
QA Metrics in Software Testing: Definitions, Types, Formulas & Examples
This article aims to define the term quality assurance metrics (QA metrics) and explain why they are important in software testing. We will also explain the different types of QA metrics, discuss a few essential QA metrics, give real-world examples of QA metrics, and offer tips for choosing the right metrics for your team.
What are QA metrics?
QA metrics are indicators that help you evaluate everything from the quality of new product releases and the efficiency of your test efforts, to the overall performance of your team’s software development lifecycle (SDLC) and the health of your application.
According to Indeed, quality assurance metrics can be thought of as processes that QA engineers and software developers use to improve the quality of their products by improving testing. The role of QA metrics is to provide measurements that QA engineers, developers, and other stakeholders can use to track the progress of testing, optimize their quality assurance processes, and ultimately help inform a number of key decisions around test strategy, resourcing, and release-readiness.
Why do QA metrics matter?
In order to measure, communicate about, or improve the quality of your product in a meaningful way, you need a way to verify whether your QA processes are working effectively. That’s why QA metrics are key. By tracking and measuring metrics, a QA team can understand where their testing strategy is succeeding and where it’s falling short, which is the first step toward improving their craft.
QA metrics give you the data and insights you need to track and improve your testing procedures and find tangible answers to questions like:
What have we tested?
How long might testing take?
Can tests be completed within the given timeline?
How long did it take us to release?
How severe are the defects we have discovered?
How many severe bugs has the team found in the last two months?
What is the biggest bottleneck in our testing process?
How many features are the team adding to existing products?
What are the costs of testing?
Good answers to these types of questions provide teams with the knowledge required to improve their testing methods. This enables companies to increase productivity and efficiency, ensuring that testing is finished in time for release and that the finished product is ready for consumption.

Types of QA metrics
When addressing the importance of a QA metric, it’s also necessary to keep in mind that there are many types of QA metrics that your team might use to track and improve your QA processes, such as:
Absolute vs. derived metrics
QA team vs. whole-team metrics
Test-focused vs. quality-focused metrics vs. productivity-focused metrics
Leading vs. lagging indicators
Absolute vs. derived metrics
Strictly speaking, there are two types of QA metrics. Absolute metrics are quantities that can be directly measured as an output of activity (like the result of a test or the number of defects logged in a certain amount of time). Other metrics are derived by combining two or more absolute metrics (for example, the total number of passing tests out of the total number of tests planned) to provide more valuable insights with context.
There are countless possible metrics or KPIs you could track related to your software testing and quality program, and any given metric can exist and be relevant at several levels. For instance, you might use certain metrics at the project level while other metrics give insights about your entire organization.
One way to categorize QA metrics is by dividing them based on what they actually measure, like (1) test effectiveness and (2) QA team efficiency. Each of these types of metrics helps to answer questions about the performance of different parts of your QA program:
Do the results of a set of tests appropriately represent the quality of the new release?
Are test execution and test management being conducted promptly without sacrificing effectiveness?
Leading vs. lagging indicators
Another way to break down QA metrics is by whether they act as leading indicators or lagging indicators.
Leading quality indicators (like test status and coverage) are often the best source of information available to make decisions about release-readiness during testing. However, these indicators do not always correlate with high-quality customer satisfaction. Conversely, lagging quality indicators (like the number of defects identified in production) can provide definitive measurements of the impact of a given release on the quality of your application, though good data on lagging quality indicators may not be available until after the fact.
Once you understand the different types of QA metrics, how do you choose the best QA metrics for your team?

How to choose the right QA metrics
When choosing metrics for your team, it’s important to pick the most appropriate metrics for your specific situation. Think about these three overarching considerations when choosing QA metrics for your organization:
The right QA metric should be measurable as well as actionable
The right QA metric is easy to update continuously
The right QA metric is relevant to your organization’s goals
In truth, only a select number of metrics will give you the information you need to optimize software testing and align your efforts with performance and quality.
Tips for choosing the right QA metrics
Now that you are aware of the three considerations to keep in mind when adopting QA metrics for your organization, here are some quick tips for choosing the right metrics.
1. Align with your testing strategy
If you run more manual tests or more automated tests (or even a combination of both), make sure to align your metrics accordingly. If performing manual testing, you might focus more on defect or test execution metrics; if performing automated testing, you may focus on metrics like passed execution, broken builds, or test time.
2. Align with your development methodology
Just like ensuring you choose metrics that align with your testing strategy, you must also align the QA metrics you choose with your development methodology. Teams who use a waterfall development process might need to focus more on regression and test coverage metrics to ensure they complete all required testing before release. Alternatively, teams who use agile methodologies might focus more on the number of unresolved defects after a sprint or the number of defects detected in production.
3. Balance metrics that track activities vs. outcomes
Metrics like tests created or tests executed can be helpful to get an overall sense of productivity of your team, but they don’t necessarily give you insight into the quality of your application or the ultimate satisfaction of your customers. Where possible, use metrics that align with business outcomes and customer satisfaction.
4. Don’t choose too many metrics
It’s easy to find yourself trying to track many different metrics simultaneously to give insight into many aspects of your software testing processes but trying to track too many metrics at any one time can make it hard to gain any meaningful insights. It can also lead to “analysis paralysis” (the inability to make any concrete decisions because you are spending too long analyzing all of the data) and ultimately be counterproductive to improving your overall quality assurance program.
5. There is no one size fits all
Make sure that every level of your organization is measuring the right metrics. Project-level managers might monitor metrics such as test effort, test coverage, and test execution to track the productivity of their team and the performance of their tests. Meanwhile, department-level managers might be more interested in tracking mean time to detect defects (MTTD) or mean time to resolution (MTTR) to help them plan future projects and measure progress.

QA metrics to consider adopting
Now that we have covered what to consider when choosing the right QA metrics for your organization, here are some examples of QA metrics to consider adopting.
Test coverage
Test coverage refers to the extent to which your test cases or suites verify your application’s functionality and ensure that you have developed tests for every part of your application. A test manager assures that all the feature requirements link with their relative test cases and vice versa. The practice ensures that all requirements have a sufficient number of tests. The goal is to keep the mapping of requirements to test cases to 100%.
A test case management system allows you to visualize your test coverage as well as to identify and analyze any gaps in your QA process. Analyzing test coverage can help you determine if you lack tests for any code or functionality. Below are several metrics that fall under the test coverage category:
Test execution progress
Helps to give an idea about the total number of test cases executed compared to the number of test cases still pending. This metric is measured during test execution and determines the coverage of testing.
Formula: Test Execution Coverage = (Total number of executed test cases or scripts / Total number of test cases or scripts planned to be executed) x 100
Functional Coverage
According to BrowserStack, functional coverage defines how much coverage the test plan provides for the business and functional requirements. Functional coverage is a metric measuring the functions invoked during software testing. The number of functions executed by a test suite is divided by the total number of functions in the software under testing to calculate this metric. It does not assign a value to each function individually, as branch coverage or statement coverage does. Instead, it simply determines whether each function was called by the tests you were running.
Risk Coverage
By taking a look at your risk coverage, you can find out how much of your company’s risk is covered by test cases. Constraints that could have a negative effect on user experience account for the majority of these risks. Risk coverage also takes into account that some tests are considerably more significant than others and have a bigger risk weight. Once the risks are understood, testing may be designed to ensure that potential hazards do not have genuine negative effects. When tests are developed to address these risks, there is a far greater chance of being both technically and financially successful.
Example: If an application for medical device data uses a third-party API to search and retrieve medical data and the API becomes unresponsive (a major risk), how would the app respond? The risk coverage metric accounts for these situations and creates/designs tests appropriately in order to prevent the software from being unusable if a risk materializes.
By measuring risk coverage, you gain insight into:
1. How thoroughly your biggest business risks were tested
2. Whether your biggest risks are meeting expectations
3. The percentage of your business risk that is not tested at all
Defects per requirement
This QA metric keeps track of how many defects or issues each unit discovers while being tested. This may aid developers in determining which requirements could need more development to function properly and effectively.
Regression and effectiveness of change metrics
As new features get built into the software, testers are often faced with the challenge of testing all these new features while ensuring nothing from the previous sprints break as a result of defect fixes and changes to code. Changes usually induce new defects, jeopardize timelines, reduce stability, and more.
Regression metrics help you understand how effective changes were in addressing user concerns, the impact on the stability of the existing system, and whether they present more benefits than drawbacks. Regression metrics include Defects per Release (or defects per build/ version) and Defect Injection Rate.
Defect injection rate
Defect injection rate refers to the number of defects that were discovered and reported during a particular iteration of product development (ex: software program). It is the total number of known defects regardless of whether they were discovered and immediately fixed or not.
This metric aids in your ability to predict the number of defects expected per new change. As a result, test teams can better understand their ability to identify and fix defects brought on by new changes.
Formula: Defect injection rate = Number of tested changes / Problems attributable to the changes
For example: If ten changes were made and 30 defects were attributable to the changes, then each change injected three defects meaning the defect injection rate is 3 per change.
Effect of testing changes
This refers to the total number of defects a development team can attribute to changes or revisions. This may entail making sure that defects have the proper fix versions attached when they are reported to development. Although it requires some initial effort to categorize defects as change related or not, the time spent doing so is well worth it.
Test team metrics
Test team metrics track the distribution of testing efforts for teams and individual team members. These metrics help you understand team dynamics like whether work allocation is equal for test team members and whether any team member needs extra clarification. It also helps encourage knowledge transfer between team members. Test team metrics include:
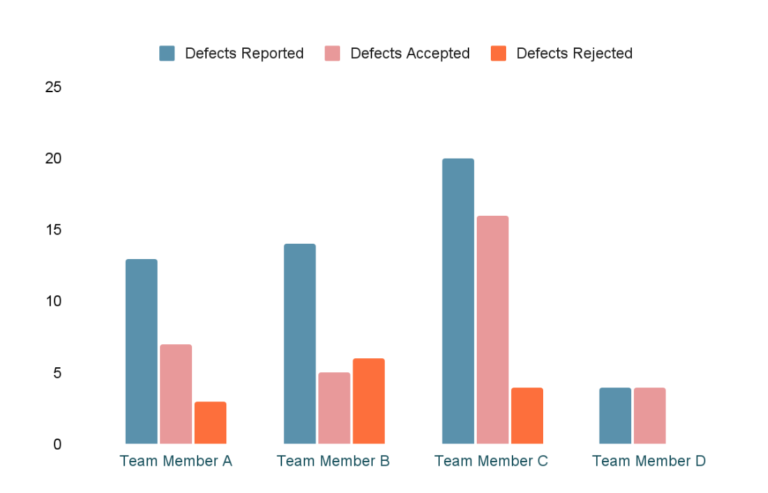
The number of defects reported and rejected
This metric is helpful in determining how many defects each team member is catching which can help QA leads evaluate team members and allocate workloads. This metric is important because if you report defects that aren’t useful (i.e.: duplicates, irreproducible, working as intended), you’ll be wasting product/development time. So a team member who catches a lot of defects but also has a big return rate can be deemed less productive than someone who detects fewer defects but doesn’t have a high return rate.
The number of test cases allocated to each team member
As the name implies, this metric measures the number of test cases allocated to each test team member. This is yet another metric that helps QA leads allocate work and make sure that each team member has the appropriate amount of work for their abilities.
The number of test cases executed by each team member
Test cases executed measures how much work (the number of tests) each member of your team completes. Similar to the metric above, this can help team leads track how much work each team member completes.
Test effort
Test effort metrics assist in determining how many tests a product needs, how long it will take to accomplish all your testing, and how long it will take to fix bugs in your product. These metrics are especially important because they help to better understand any variations in testing and help establish baselines for any similar future test planning projects. Test efforts are evaluated with various metrics:
Number of tests in a given time frame
This metric aims to tell you the number of tests completed in a given time frame. This helps developers plan for future testing times. The number of tests per period can be determined by dividing the number of completed tests by the total testing time.
Formula: Number of tests in a certain time period = Number of tests run/Total time
Test design efficiency
This metric aims to assess the design efficiency of the executed test. Test design efficiency measures how long it takes a team to completely design a test for a particular requirement. To find the average time, divide the total number of tests your team designs by the total time taken to design them.
Formula: Test Design Efficiency = Number of tests designed / Total time
Number of bugs per test
The number of bugs per test, sometimes referred to as the bug find rate, measures the number of bugs (or defects) found during every stage of testing. To find this metric, you can divide the total number of defects by the total number of tests.
Formula: Number of bugs per test = Total number of defects / Total number of tests
Average time to test a bug fix
This QA metric helps to understand how much time was spent testing a bug fix. You can find this average by dividing the total number of bug fixes your team tests by the total time spent testing bug fixes. Other metrics in the test effort group include defects per test hour, number of tests run, and average time to test a bug fix.
Formula: Average Time to Test a Bug Fix = Total time between bug fix & retest for all bugs / Total number of bugs
Defect distribution
The defect distribution metric helps you understand the types of flaws in your product, how they correspond to testing, which parts of your software (or process) are susceptible to defects, and ultimately where to focus your testing effort.
Teams tracking this QA metric can create graphs that track how the distribution of defects changes over time and map flaws based on variables like cause, type, or severity. By analyzing and comparing these numbers, teams can better monitor their progress and increase the quality of their releases. Defect distribution metrics include the number, percentage, or severity of defects distributed by categories like severity, priority, test type, and so on.
Defect detection and recovery
The defect detection and recovery metric tracks how long it takes to locate and remove bugs in your product. It is important for testers to be able to plan future testing schedules and be more efficient with their time and processes. Mean time to detect defects (MTTD) and Mean time to resolution (MTTR) are the two main metrics in this category:
Mean time to detect defects
Mean time to detect defects or MTTD refers to the mean time it takes your organization to detect issues in a product. The sooner a defect is detected, the sooner you can fix it. We all know that it is much easier (and cheaper) to fix an issue earlier on, by measuring how much time it takes to uncover issues, you are taking the first step towards improving said time.
You can find the MTTD by dividing the time spent locating defects by the total number of defects your team locates.
Formula: MTTD = Amount of time spent locating defects / Total number of defects located
Mean time to resolution
Mean time to resolution or MTTR refers to the mean time it takes an organization to fix bugs that affect users. Tracking this metric is important because maintaining a low MTTR is crucial to making sure that all systems are functioning properly. Simply put, when things are not working, users get upset and you make less money.
Formula: MTTR = Amount of time spent fixing a defect / Total number of defects located
Testing ROI Metrics
Testing ROI Metrics help calculate the total cost of testing, the total cost of individual testing components, and the ROI of your organization’s testing processes. It is important to compare the expected cost of testing to the actual expenses used for testing. These metrics can aid developers and QA leads when budgeting for future testing expenses and assessing the efficiency of their testing processes. They can also help to track how much labor and time are used.
Cost per bug fix
Cost per bug fix is a test economic metric that informs you of how much it costs your company to fix a defect. The cost per bug fix is calculated by the amount spent on a defect per developer.
Formula: Cost per bug fix = Hours spent on a bug fix x developer’s hourly rate
Example: If a developer spent 20 hours on fixing a bug and their hourly rate is $50, then the cost of bug fix is 20 * 50 dollars = 1,000 dollars. (Note: teams can also account for the cost of retesting for a more accurate measurement.)
Cost of not testing
This metric helps you to understand the expenses associated with not testing your product. If a new set of features was released but needed to be reworked, the cost of reworking them is the “cost of not testing.” This not only includes costs associated with having to redo a product but also includes subjective factors like declining customer loyalty, loss of profit, more customer service requests, and product failures.
Schedule variance
Schedule variance is the difference between the planned testing time and the actual testing time.
Formula:
Schedule variance (if testing finishes earlier than planned) = Planned schedule – Actual schedule
Schedule variance (if testing finishes later than planned) = Actual schedule – Planned schedule

Glossary of QA metric formulas
Average Time to Test a Bug Fix = Total time between bug fix & retest for all bugs / Total number of bugs
Cost per bug fix = Hours spent on a bug fix x developer’s hourly rate
Defect Category = Defects belonging to a particular category/ Total number of defects.
Defect Density = Defect Count/Size of the Release/Module
Defect injection rate = Number of tested changes / Problems attributable to the changes
Defect Leakage = (Total Number of Defects Found in UAT/ Total Number of Defects Found Before UAT) x 100
Defect Removal Efficiency (DRE) = Number of defects resolved by the development team/ (Total number of defects at the moment of measurement)
Defect Severity Index (DSI) = Sum of (Defect * Severity Level) / Total number of defects.
MTTD = Amount of time spent locating a defect / Total number of defects located
MTTR = Amount of time spent fixing a defect / Total number of defects located
Number of bugs per test = Total number of defects / Total number of tests
Number of Test Runs Per Time Period = Number of test runs / Total time
Review Efficiency (RE) = Total number of review defects / (Total number of review defects + Total number of testing defects) x 100.
Schedule variance (if testing finishes earlier than planned) = Planned schedule – Actual schedule
Schedule variance (if testing finishes later than planned) = Actual schedule – Planned schedule
Test Case Effectiveness = (Number of defects detected / Number of test cases run) x 100
Test Case Productivity = (Number of Test Cases / Time Spent for Test Case Preparation).
Test Coverage = (Total number of requirements mapped to test cases / Total number of requirements) x 100.
Test Design Efficiency = Number of tests designed / Total time
Test Execution Coverage = (Total number of executed test cases or scripts / Total number of test cases or scripts planned to be executed) x 100
In this article:
Why QA metrics matter:
Quality assurance metrics are important for more than one reason. First and foremost, they are decision points that lead you to take action. How effective those actions are in improving your quality level depends on the metrics you choose.
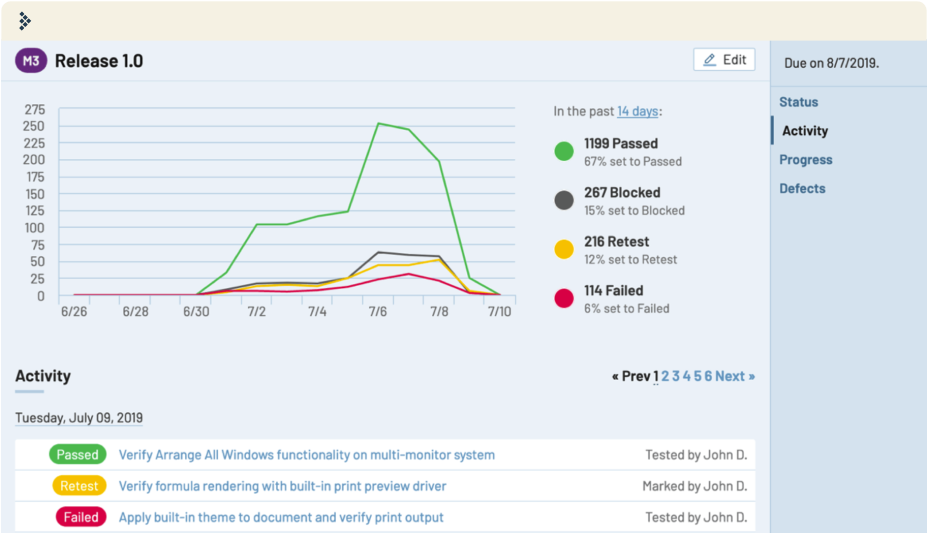
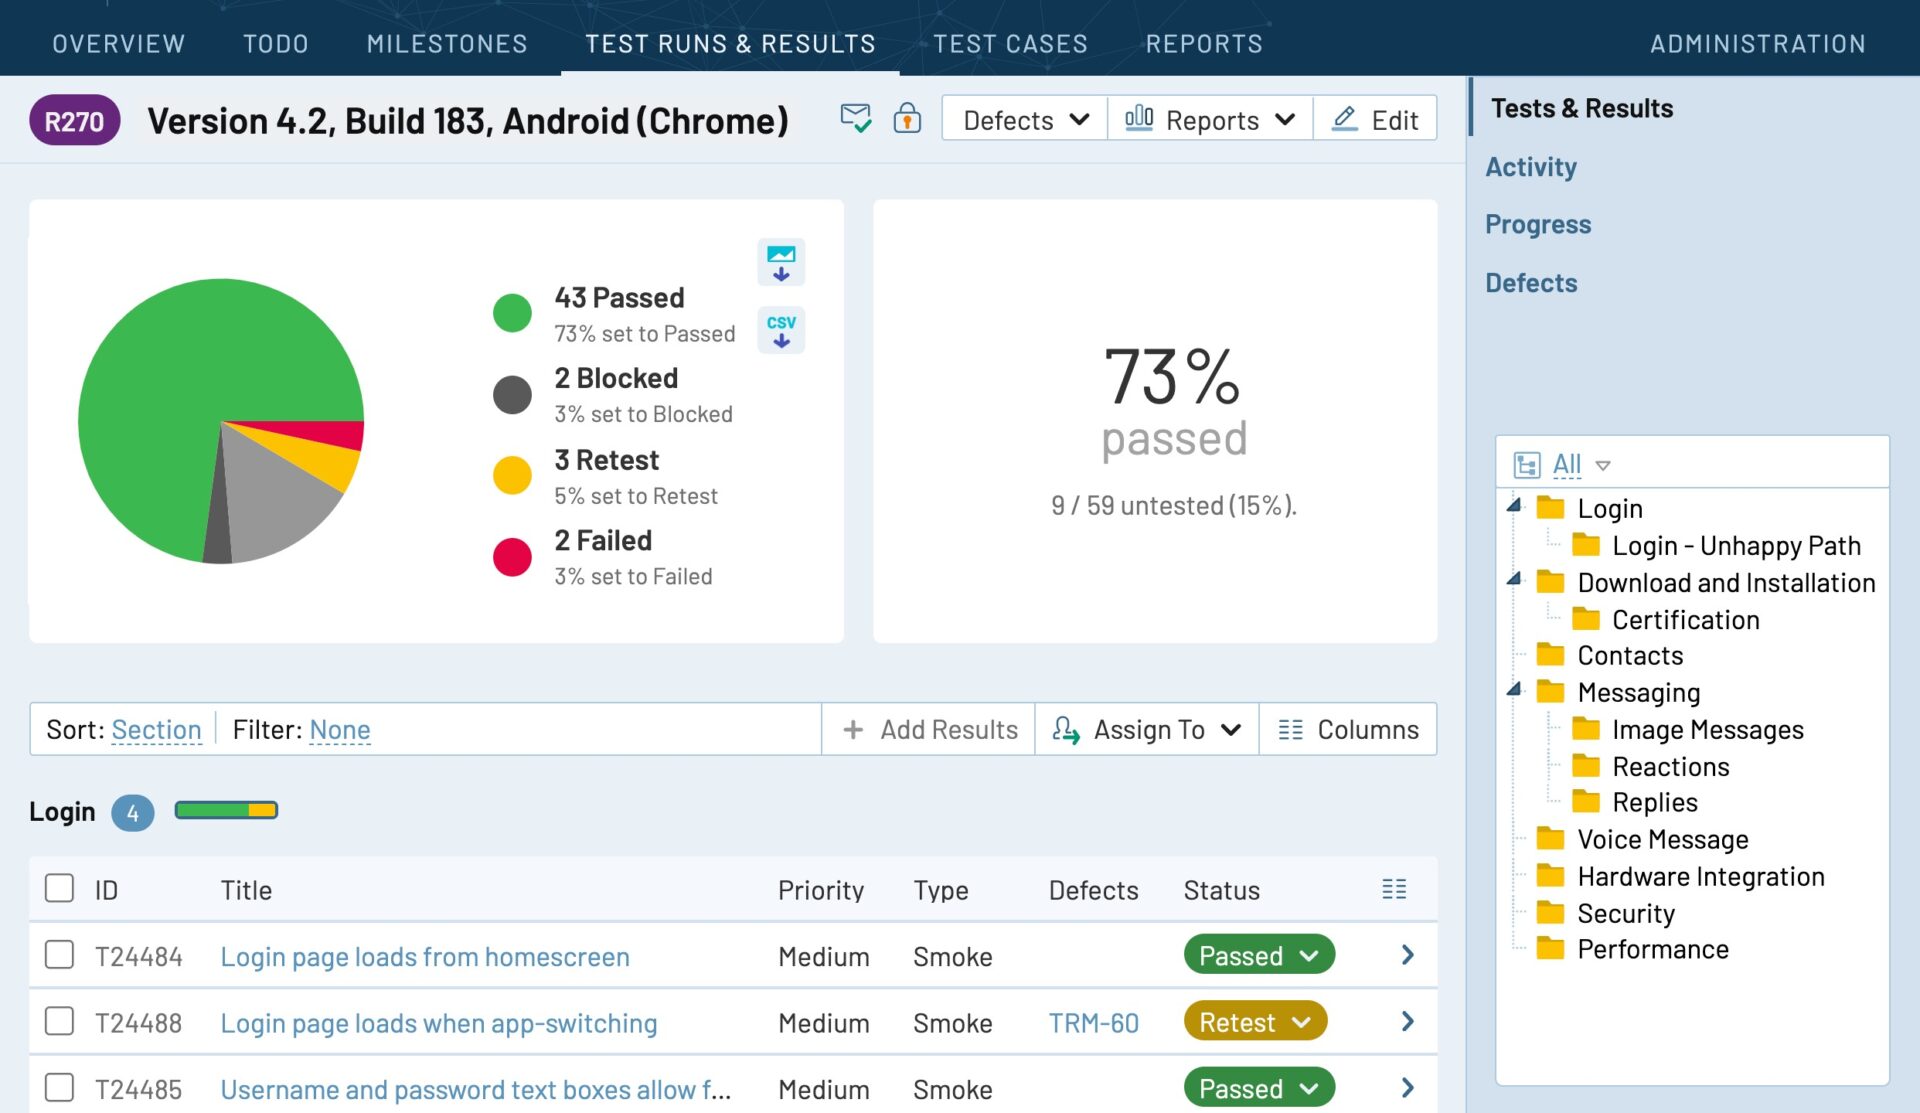
QA metrics also help you judge your productivity and efficiency over time. How many test cases are added to new release? How many tests pass in the first run, how many require a retest, and how many lead to new bug reports?
TestRail helps you keep track of those QA metrics and much more. Reports on various levels give you insights about project status, milestones, or even individual test runs. All test results and project activity is archived so that you can learn from the past, discover trends, and be better prepared with each new release cycle.
Join over 10,000 QA teams using TestRail to release flawless products, faster











TestRail is used by leading organizations everywhere to track their quality assurance metrics.
Beyond the product

How to Report on Traceability and Test Coverage in Jira
In this blog post, we cover why test coverage and traceability are essential, and how you can show test coverage, manage requirements traceability, and create a traceability report when using Jira to manage software development.
The 2023 Software Testing Quality Report
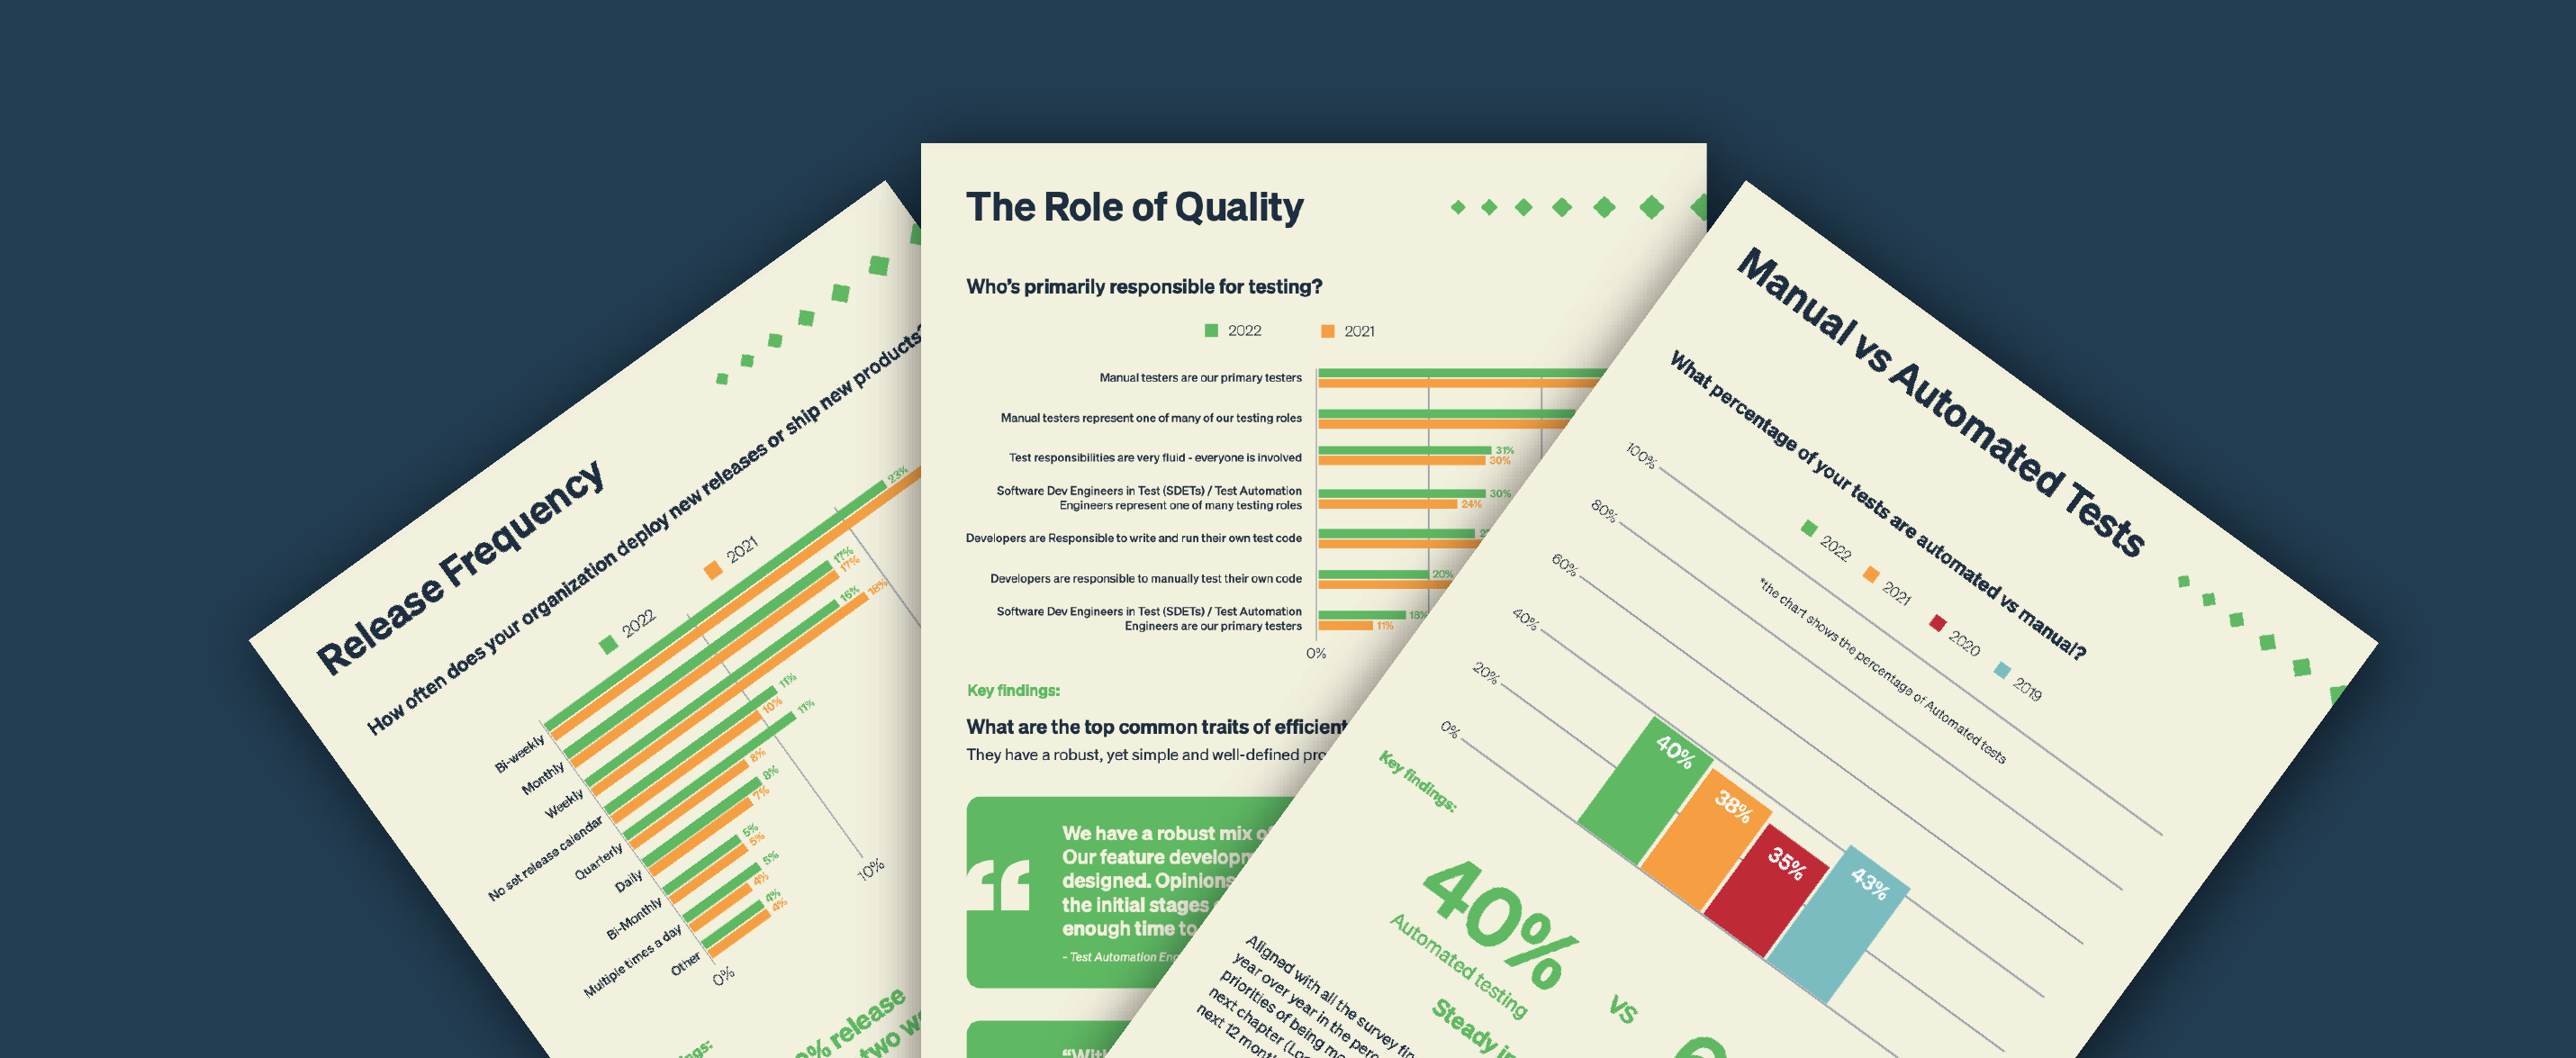
In this report, we uncover surprising data about the adoption of test automation, questions about the business impact and ROI of testing, and people’s primary objectives around quality right now. Plus, learn more about the most common traits of efficient and happy QA teams—the key to unlocking a high-performing team may be simpler than you think!

Test Automation: Don't Believe the Hype
In this webinar, Diogo Rede, TestRail’s Solution Architect & Testing Advocate, walks you through common misconceptions about test automation and how to build an approach to automation that works for your team's unique needs.