By now, the necessity of dedicated Quality Assurance mechanisms within software development pipelines is beyond question. Inadequate QA coverage won’t just result in a sub-par application; it will deliver unsatisfactory user experiences and adversely impact brand credibility.
In light of life, most tech-first companies are investing significantly in their QA functions. To quote the 13th edition of the World Quality Report by Sogeti:
“Acceleration in Quality transformation is visible across the board….the importance of quality assurance has been reinforced: our survey sample of 1,750 CIOs and senior tech leaders emphasizes the value of testing than ever before.”
However, to justify the increased investment, the results of software testing must be closely and consistently monitored. Naturally, stakeholders require the right metrics to evaluate QA performance and its role in enhancing development processes and timelines.
Following the age-old wisdom of “if you can’t measure it, you can’t improve it,” we’ve put together a list of 20 essential QA metrics that will help you gain insight into the efficacy of your test protocols & teams.
Quantitative vs. Qualitative QA Metrics
Before diving into the list, let’s take a moment to explore two major categories of QA metrics – Quantitative (Absolute numbers) and Qualitative (Derived Metrics).
Quantitative Metrics (Absolute Numbers)
Quantitative metrics are exactly what they sound like. They are whole numbers, measuring a single aspect of the QA process. Some of the qualitative metrics listed here are:
- Escaped Bugs
- Defects per requirement
- Number of tests run over a certain duration
- Test review rate
- Defect capture rate
- Average bugs per test
- Time to Test
- Test Cost
- Cost per bug fix
- Defects per software change
Qualitative Metrics (Derived Numbers)
By themselves, quantitative metrics cannot offer a full picture of a QA team’s performance. For example, just the number of average bugs per test doesn’t say much if it’s not being seen in context of say, total number of tests run and average time to run each test. Qualitative metrics help with this, by relating different, relevant metrics with each other so as to provide a nuanced picture of a team’s speed, accuracy or effectiveness.
A few qualitative metrics listed here are:
- Test Coverage
- Test Reliability
- Cost of not testing
- Test Execution Status
- Defect Distribution over Time
- Defect Resolution
- Test Case Effectiveness
- Defect Leakage
- Test Case Productivity
- Test Completion Status
- Test Review Efficiency
Top 20 Essential QA Metrics
1. Escaped Bugs
The primary reason QA exists is to prevent most (or, ideally, all) bugs from reaching production. Ideally, customers should not have to detect and report any major bugs after an app or feature goes live.
Therefore, the number of escaped bugs should be the primary metric to judge your entire QA process. If your customers are not reporting any bugs, and your team does not have to pause everything to run hotfixes, it indicates your QA activities are yielding positive results.
However, if major bugs repeatedly escape and disrupt the user experience, you may need to rethink your test suites. Thankfully, when customers report bugs, you can quickly identify problem areas and patterns instead of having to re-examine entire architectures.
Realistically, however, it is not possible to identify and resolve every possible bug before hitting production – especially in demanding release timelines. But you can decide upon an acceptable number of quickly fixable bugs that won’t bother the customer too much.
For example, if your team has to release a new feature in 3 weeks, you cannot guarantee a completely bug-free product. So, take the time to identify the feature’s primary purpose and main user paths. Then, ensure that bugs do not disrupt it and that the new feature does not break the app’s existing UI/UX.
Focus on resolving these, with the idea that smaller bugs may show up in prod, but they won’t be as intrusive to the UX.
Finally, when judging with this metric, figure out if major bugs are escaping. If so, you might have to add or fix existing tests.
Of course, your long-term goal should be to design end-to-end test suites that capture every possible bug. That takes time, meticulous planning, and learning from actual tests, so meanwhile, use the framework above to prioritize.
2. Test Coverage
This metric should be able to answer the question, “how many tests are we running and which software areas do they cover?”
Calculated as a percentage, test coverage defines how much of the application is being verified by existing tests.
It’s easy to calculate this with two quick formulas:
- Test Execution = Number of tests already run/Total tests to be run) x 100
- Requirements Coverage = Number of requirements covered by existing tests/Total number of requirements) x 100
The second formula is especially important to verify that all (or a majority) of software features are being checked by QA. For example, if you simply run 500 tests, the suite does not guarantee high product quality by default. Tests must cover critical user paths, core feature performance and obvious customer preferences.
3. Defects per requirement (Requirement Defect Density)
Monitoring the number of defects that appear for tests covering each requirement is particularly useful. This QA Metric can reveal if certain requirements are riskier than others, which helps product teams decide whether those features should be released.
If testing a certain requirement uncovers too many defects, it could actually uncover problems with the requirement itself. Of course, it is possible that the test cases themselves require refactoring but rarely do more defects show up because of flaws in test structuring.
For example, if tests on Requirement A generate 38 defects while those on Requirement B generate just 7, this is a signal for testers to examine if Requirement A requires modified tests. It also signals if the requirement may not be realistically deployable in its current state. To decide the latter, get devs and product managers involved.
4. Test Effort
Evaluating test effort requires you to take multiple other metrics into account. These sub-metrics (so to speak) reflect how many tests are being run, and for how long. Generally calculated as averages, test effort numbers help you decide if you’re running enough tests and if they are catching enough defects.
A few important numbers:
- Number of tests run per (duration): Number of tests executed / Total duration
- Test review rate: Number of tests reviewed / Total duration
- Defect capture rate: Total defects captured / Total test run duration
- Average bugs per test: Total number of bugs / Total number of tests
5. Test Reliability
A perfect test suite has the following characteristics:
- Close correlation between number of bugs and failed tests
- Each failed test includes a real bug instead of being flaky
- A test passes only when the feature under test is entirely bug-free
The closer your test suite is to the above benchmarks, the more reliable it is. Some important questions here:
- Are tests failing because of actual bugs, or because of bad design? If so, how many?
- Are tests flaky? If so, how many and how often?
Tracking test reliability is necessary to generate confidence that QA is adequately testing software – actually doing its job. Like all effective QA metrics, this one helps testers continuously improve on existing test cases, scenarios & practices.
6. Time to Test
This metric reveals how quickly a team or tester can create and execute tests without affecting software quality.
Of course, the metric will differ between manual and automated testing cycles, the latter being much faster to execute. Additionally, the tools and frameworks used for QA also make a real difference in time to test.
It might be challenging to combine these numbers so use the following averages:
- Avg time to create tests = Total time to create tests / Total number of tests created
- Avg time to run tests = Total test run time / Total number of tests run
Once you have initial numbers for this QA team performance metric, you can incorporate best practices and upgrade tools to increase both averages. Keep in mind that shortening average times means nothing if it lowers quality standards.
7. Test Cost
Most QA teams have to work within specific budgets. To justify their spending, they must keep a close account of how much they plan to spend and how much they end up spending. The two main numbers here:
- Total cost allocated for testing: The monetary amount that management has approved for QA activities for a specific duration (quarter, year, etc.)
- Actual cost of testing: The actual monetary amount that went into running necessary tests. This calculation can include the cost of testing per hour, per test case or per requirement.
For example: if your total allocated cost is 2000 dollars and you have to test 200 requirements,
Cost of testing per requirement: 2000/200 = 10 dollars
Cost per test hour: 2000/number of test hours (let’s say 200) = 100 dollars
Cost per test case: 2000/ number of test cases (let’s say 50) = 40 dollars
The above example assumes that all requirements take the same time and the same dollar amount to test. However, this is often not the case in the real world, so you’ll have to tweak your calculation of this QA metric accordingly.
8. Cost per bug fix
Simply put, this is the amount spent to have each bug fixed by a developer.
Cost per bug fix = Time taken to fix * the dev’s hourly rate
You can also go the extra mile to factor in the cost of testing each bug fix which offers a more comprehensive number for final reporting.
9. Cost of not testing
Calculating the cost of not testing might seem counterintuitive but is a great way to establish the necessity of QA functions. Monitoring this QA metric is especially important if you have to justify increased budgetary or hiring requests to stakeholders.
The cost of not testing refers to the cost of fixing any feature that went into production without testing, failed and needed fixing.
Not only can you calculate cost based on the number of dev hours spent to fix the flaw but you can also include subjective costs such as:
- More time devoted to customer calls & support requests
- Product downtime
- Loss of customer trust, loyalty and brand credibility
Untested features can have far-reaching repercussions beyond a simple lack of functionality. Ensure that you can access customer support and product team personnel who can give you clarity on what those repercussions are.
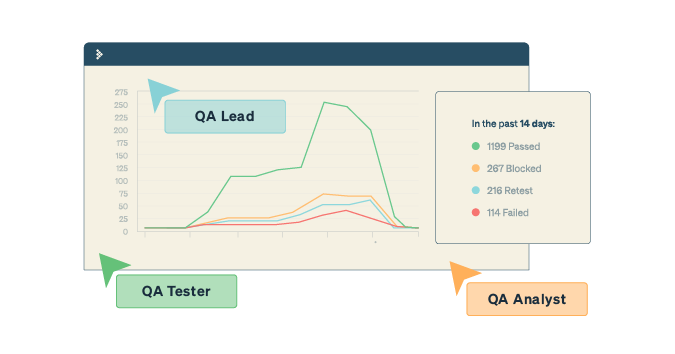
10. Test Execution Status
At any given time, you should be able to get accurate information of how many tests have passed, failed, are blocked, incomplete or not executed yet. Represented as numbers and/or percentages, this metric is necessary for daily/weekly reporting. It’s also a quick snapshot of a team’s average efficiency, as these numbers can be compared with previously set benchmarks.
Quick tip: Turn Test Execution status numbers into visual aids like bar graphs or pie charts for easier reporting. Raw numbers don’t capture the eye as effectively.
11. Defects per software change
Oftentimes, when a new feature is added or an existing feature is altered, testing these changes reveals defects that did not exist in previous tests. For example, if you’ve added an extra button on a webpage, tests might show that previous buttons (which were rendering fine) are now askew and have misaligned text. In other words, defects have shown up purely because of a new change.
For example, if five changes were made and 25 bugs showed up after testing, you can attribute roughly five bugs to each change. Of course, it’s always possible that one change introduced more defects than the others.
If you study this QA metric long enough across multiple projects, you can make informed projections about what bugs to expect with each change. With these numbers in hand, your team can better plan their time, resource investment and availability when starting new testing cycles.
12. Defect Distribution over Time
At the end of a test cycle, it’s important to chart how many defects exist and where they come from. This reveals if the QA team is progressing in identifying and resolving more bugs as they work through more cycles.
Splitting defects based on their origin also helps pinpoint which areas need more attention. Some common categorizations here are:
- Defect Distribution by Cause
- Defect Distribution by Module
- Defect Distribution by Severity
- Defect Distribution by Platform
If defects are increasing in a certain category, you’ll have an easier time pinpointing the cause. For example, if more defects show up in one platform, that might indicate that the software requires more optimization for that particular environment.
13. Bugs found vs. Bugs Fixed
The Bugs found vs. Bugs Fixed metric is one of the key metrics to judge the efficacy of the QA process. It maps the number of bugs found to the number fixed and provides an average that objectively demonstrates if QA is doing its main job.
This analysis is also helpful in identifying patterns in which bugs show up and are removed. It provides vital insight into the current stage of defect management.
To get this number, you must first track the number of bugs found and resolved every day in a test cycle. For example, let’s say you have a five-day test cycle, and you’ve collected the following numbers:
| Test Cycle Date | Bugs Created | Bugs Resolved | Total bugs created till date | Total bugs resolved till date |
| 01-09-2022 | 6 | 4 | 6 | 4 |
| 02-09-2022 | 3 | 0 | 9 | 4 |
| 03-09-2022 | 4 | 4 | 13 | 8 |
| 04-09-2022 | 2 | 4 | 15 | 12 |
| 05-09-2022 | 2 | 3 | 17 | 15 |
By the end of the test cycle, 17 bugs were created/identified, and 15 have been resolved. Compare this to previous test cycles, and you can determine if testers are getting better at finding and fixing bugs.
14. Defect Resolution Percentage
This QA metric reveals how efficient the development team is when analyzing and fixing bugs reported by QA teams. While bug resolution should ideally not be a QA concern, keeping track of this number can help explain delays in shipping – especially useful for conversations with management.
To calculate this number, track the total number of defects reported to the dev team and the total number of defects fixed within a test cycle. Then, apply this formula:
Defect Resolution % = (Total number of defects fixed / Total number of defects reported) x 100
Again, track defection resolution % over time to verify if QA is providing the desired results for the SDLC.
15. Defect Age
Defect age measures the average time developers take to fix a defect, from when it starts to when the bug is actually resolved.
Defect Age = Difference between the time of bug creation and time of bug resolution
Generally, defect age is measured in days. Let’s say the bug was identified on 6/4/2022 and was fixed on 23/4/2022. In this case, the defect age is 17 days.
Progressively low defect age is a powerful indicator of a QA team’s maturation. It means bugs take less time to fix with every test cycle.
16. Test Case Effectiveness
Derived as a percentage, this number indicates the efficacy of test cases in detected bugs. In other words, how many test cases executed by your QA team have successfully identified bugs in a single test cycle?
The formula is simple:
Test Case Effectiveness = (Number of bugs found/Number of test cases executed) x 100
An important measure of test case quality, the number should incrementally grow over progressive test cycles. It is one of the most obvious indicators of a QA team’s performance.
17. Defect Leakage
Defect leakage may seem similar to the first metric in this list ( i.e. escaped bugs). However, in this case, you’re monitoring the number of bugs that escape to the UAT (User Acceptance Testing) stage. Therefore, dealing with defect leakage is far less serious than handling escaped bugs.
Essentially, this refers to the number of bugs that show up in UAT, after the app has been through multiple layers of testing. Ideally, your test cases should filter them out before potential users touch your product.
Calculate this as:
Defect Leakage = (Total numbers of defects in UAT/ Total number of defects found before UAT) x 100
18. Test Case Productivity
You probably won’t have to report this metric to management, but measuring it helps with setting realistic expectations for your team.
Test case productivity evaluates the effort required to build test cases for a specific sprint/cycle. The formula is:
Test Case Productivity = (Number of Test Cases/Effort required per Test Case) x 100
Obviously, “Effort Required per Test Case” won’t be an exact number. Certain test cases require more design work than others. But you can ask your testers to provide a fair average. This metric will give you a sense of what is reasonably possible for your team to accomplish per cycle.
19. Test Completion Status
Not every test case your team designed will be executed to completion. Some tests will pass, some will fail, and some will end up not being executed or blocked—monitoring test completion status is another KPI indicator of overall team performance.
A few different formulas whose results will combine to provide the big picture of test completion status:
- % of Test Cases Executed = (Number of test cases executed/Number of test cases created) x 100
- % of Test Cases Not Executed = (Number of test cases not executed/Number of test cases created) x 100
- % of Test cases Passed = (Number of test cases passed / Number of test cases executed) x 100
- % of Test cases Failed = (Number of test cases failed / Number of test cases executed) x 100
- % of Test cases Blocked = (Number of Test cases blocked / Number of test cases executed) x 100
With these numbers in hand, you can quickly judge the current state of QA operations. For example, if the % of test cases passing is lower than % of test cases blocked, there might be a foundational issue with the test case design or the test environment. Now you know what problem to zero in on to improve outcomes for the next sprint.
20. Test Review Efficiency
Even though test cases may have flagged bugs, each such flag requires some review by a tester, even if it takes just a few minutes – and it usually takes longer. However, depending on the software and its development stage, tests may return a large number of bugs. The time to review each does add up, which is why you need to calculate test review efficiency.
Test review efficiency % = (Number of tests reviewed/ Total number of tests requiring review) x 100
Of course, the formula for this QA metric must be applied in the context of a certain duration. Let’s say that in a test sprint of 7 days, 58 bugs were detected but given the nature of these bugs, your team could only review and forward 45 of them for resolution; Your test review efficiency then stands at 77%.
Again, this is a good number to measure your team’s performance, and what they need to review more defects.
Closing Thoughts
The necessity of measuring a QA team’s performance cannot be overstated. Like every investment, QA must show adequate returns to account for its existence in any SDLC. Fortunately, the necessity and efficacy of a QA function has been proven innumerable times, as long as it adheres to best, evolving practices.
Measure the QA metrics described above, and you will have profound clarity on how testing teams are performing and the absolute value they bring to the table.