Awhile back I had an interesting problem to solve. I was involved with refactoring a cloud-based application that did intensive data analysis on very large data sets. The entire application —business logic, analysis algorithm and database — lived in a single virtual machine. Every time the analysis algorithm ran, it maxed out CPU capacity and brought the application to a grinding halt. Performance testing the application was easy: We spun up the app, invoked the analysis algorithm and watched performance degrade to failure. The good news is that we had nowhere to go but up.
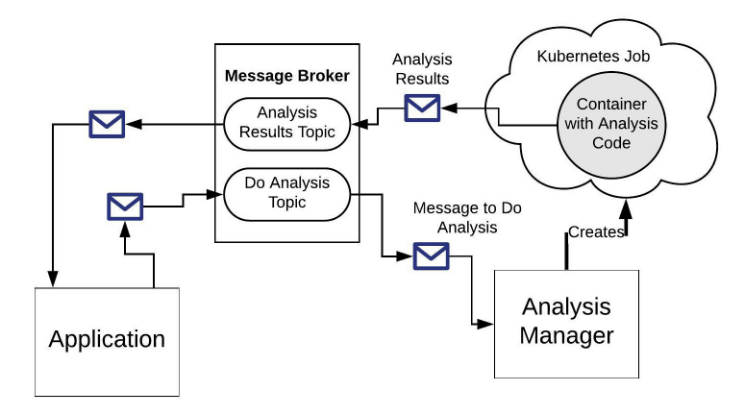
The way I solved the problem was to use ephemeral computing. I implemented a messaging architecture to decouple analysis from general operation. When analysis is needed, the app sends a message to a topic. An independent analysis manager takes the message off the topic and responds by spinning up a Docker container within a Kubernetes job. The Docker container running in the Kubernetes job has the analysis code. The Kubernetes node has 32 cores, which allows the code to run fast. Then, when the job is done, the Kubernetes job is destroyed. (See figure 1.)
We end up paying only for the considerable computing resources we need, when we need them.
Figure 1: An ephemeral architecture creates and destroys resources as needed
Using message-driven architecture in combination with automation to provision environments ephemerally has become a typical pattern, so I wasn’t really breaking any new ground. But I did encounter a whole new set of problems in terms of testing — particularly performance testing.
Get TestRail FREE for 30 days!
Implementing a Performance Test
The way we ran performance tests was standard. We spun up some virtual users that interacted with the application to instigate the analysis jobs. We started small and worked our way up, from 10 virtual users to 100. We didn’t go beyond that count because the service-level agreement we needed to support called for 10 jobs running simultaneously, but we went up to 100 to be on the safe side.
Defining the Test Metrics
Once we had the test ready to go, we decided what we wanted to measure. Our list was short: We wanted to measure the time it took for the message to go from Application to Analysis Manager, and we wanted to measure how long it took for the Kubernetes job with the Docker container to spin up, run and then be destroyed. (We put determining the accuracy of analysis out of scope because this type of testing fell under functional testing. There was no sense in reinventing the wheel.)
Once we determined the metrics we wanted to measure, the next step was to figure out how to get at the information. This is where taking a DevOps approach comes into play.
Taking the DevOps Approach
Given that the system we created was message-based, we couldn’t just measure timespan, as is typical of an HTTP request/response interaction. Rather, we needed to trace activity around a given message. Thus, we took the DevOps approach.
I got together with the developer creating the message emission and consumption code. Together we came to an agreement that information about the message would be logged each time a message was sent or received. Each log entry had a timestamp that we would use later on. We also decided that each log entry would have a correlation ID, a unique identifier similar to a transaction ID.
The developer implementing messaging agreed to create a correlation ID and attach it to the “do analysis” message sent to the message broker. Any activity using the message logged that correlation ID in addition to the runtime information of the moment. For example, the application logged information before and after the message was sent. The Analysis Manager that picked up the message logged receipt data that included this unique correlation ID. Message receiving and forwarding was logged throughout the system as each process acted upon the message, so the correlation ID tied together all the hops the message made, from application to analysis to results.
We also met with the developer implementing the Kubernetes job to have the correlation ID included when logging the job creation and subsequent analysis activity, where applicable.
Getting the Results
Once we had support for correlation IDs in place, we wrote a script that extracted log entries from the log storage mechanism and copied them to a database for review later on. Then, we ran the performance test. Each virtual user fired off a request for analysis. That request had the correlation ID that was used throughout the interaction. We ran the tests, increasing the number of virtual users from 10 to 100.
One of the results the test revealed was that the messages were taking a long time to get to topic and onto the Analysis Manager subscriber. We checked with the developer who created the messaging code, and he reported that everything was working as expected on his end. We were perplexed.
Gotcha: Everything Is Not the Same Everywhere
Our performance issue is not at all atypical in software development — things work well in the development environment but behave poorly under independent, formal testing. So we did a testing post-mortem.
When we compared notes with the development team, we uncovered an interesting fact: Developers were using one region provided by our cloud service, but we were testing in another region. So we adjusted our testing process to have the Kubernetes job run in the same region as the the one used by the developer. The result? Performance improved.
We learned a valuable lesson. When implementing performance testing on a cloud-based application, do not confine your testing activity to one region. Test among a variety of regions. No matter how much we want to believe that services such as AWS, Azure and Google Cloud have abstracted away the details of hardware from the computing landscape, there is a data center down in that stack filled with racks of computers that are doing the actual computing. Some of the data centers have state-of-the-art hardware., but others have boxes that are older. There can be a performance difference.
In order to get an accurate sense of performance, it’s best to test among a variety of regions. When it comes to provisioning ephemeral environments, everything is not the same everywhere.
Join 34,000 subscribers and receive carefully researched and popular article on software testing and QA. Top resources on becoming a better tester, learning new tools and building a team.

Opportunity for Improvement: Using System Monitors
The performance testing we devised used virtual users in conjunction with prescribed logging to create load and measure results. The testing relied on timestamp analysis to determine performance behavior. This was a good start. After all, any performance testing is better than none at all. However, more is required.
Remember, the primary reason the application needed to be refactored was due to overburdening the CPUs on the virtual machine. We assumed that increasing the number of CPUs would improve performance. Our assumptions seemed correct, given the data we gathered, but without having a clear view into CPU performance, we were still only guessing.
One of the opportunities for improvement is to make direct system monitoring part of the application architecture. Using a tool such as Datadog Kubernetes monitoring or Stackdriver monitoring in a Google Cloud environment provides the insight we need into low-level performance. The important thing is for us to go beyond simple time measurement and include system runtime information as part of the library of test metrics.
Putting It All Together
Ephemeral computing makes sense for computationally intensive applications. Applications that do a lot of thinking on large data sets require a lot of expensive resources to accomplish the job. The expense is worth it as long as there is revenue coming in that exceeds the cost of execution. That’s the fundamental formula for a healthy business: profit equals revenue minus expenses. Using only the resources you need, when you need them, is the way to go.
However, ephemeral computing brings a new set of challenges to performance testing. Applications that use ephemeral computing rely on components that live only when needed and are provisioned automatically. Thus, log data is an important source for correlating test metrics among a variety of components. Also, having adequate system monitoring in place that can keep an eye on ephemeral resources at a low level is essential for understanding runtime behavior. Finally, implementing a test plan to execute tests in a variety of cloud regions will ensure that an application is running in the best environment possible.
Performance tests that combine logging, system monitoring and cloud region optimization provide a clear avenue of success for ensuring the production of quality cloud-based software when taking advantage of ephemeral computing.
Article by Bob Reselman; nationally-known software developer, system architect, industry analyst and technical writer/journalist. Bob has written many books on computer programming and dozens of articles about topics related to software development technologies and techniques, as well as the culture of software development. Bob is a former Principal Consultant for Cap Gemini and Platform Architect for the computer manufacturer, Gateway. Bob lives in Los Angeles. In addition to his software development and testing activities, Bob is in the process of writing a book about the impact of automation on human employment. He lives in Los Angeles and can be reached on LinkedIn at www.linkedin.com/in/bobreselman.
Test Automation – Anywhere, Anytime


