This is a guest post by Bob Reselman.
Any test you run will only be as valuable as the breadth and accuracy of the test data you collect. However, collecting test data can be hard, if not nearly impossible, when the digital infrastructure is spread across the planet. The trick is to implement distributed tracing.
Distributed tracing technology makes it possible to monitor the activity of a request as it makes its way through the various systems and services required to fulfill its purpose. Having a clear understanding of distributed tracing is essential for any test practitioner working with modern web applications that span the globe.
What Is Distributed Tracing?
Distributed tracing is a technique used to profile and monitor application activity as a request makes its way throughout a distributed architecture.
In days past, when web applications were executed on arrays of machines that were static or slow-changing, observing application activity was a pretty straightforward undertaking. You could install a performance monitor on a server to observe the behavior of the server overall. To monitor the activity of a particular request, you could use access application logs to get a sense of basic request-response behavior. Monitoring activity in the database usually required nothing more than using the built-in query-tracing capabilities. (See figure 1.)

Figure 1: Observing performance behavior is straightforward when machine allocation is static or slow-changing and all data resides in a common data store.
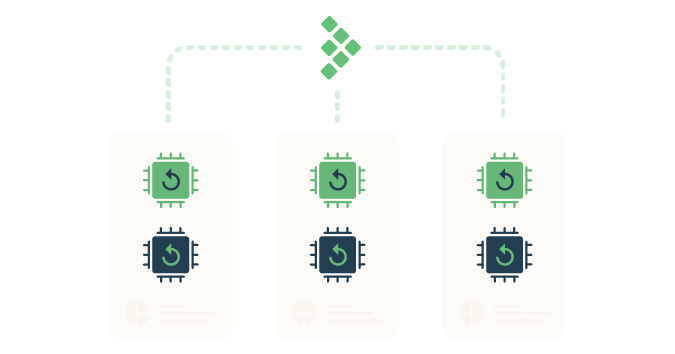
However, as cloud-based, ephemeral computing that uses resources on demand becomes more common in the digital landscape, understanding exactly what’s going on within an application becomes harder. Activity gets spread over a variety of computing resources, with each resource dedicated to a particular area of concern. (See figure 2.)

Figure 2: Applications running in the cloud can be composed of a variety of containerized components, with a given container being created or destroyed to support momentary demand.
And, instead of having the components of an application share a common database, each component might carry its own data in a way that is completely separate from any another component. Combining this degree of isolation with the fact that components can be created or destroyed at a moment’s notice to meet the ebb and flow of demand makes observing the behavior of a particular request hard.
A request can go anywhere at any time. Sometimes the request’s path will be apparent. Other times, such as when the request enters a message queue, it becomes hidden. In such cases, unless adequate precautions are taken, observing behavior is akin to herding cats. Once you figure out where one request is, another one disappears from sight.
Having a way to keep an eye on everything you can, for as long as you can, becomes indispensable, not only for performance testing but for overall system troubleshooting as well. Thus, the benefit of distributed tracing.
How Does Distributed Tracing Work?
First, there is no magic. In order for tracing to work, an application or service needs to have intelligence-enabled within its code that can emit information to a central collector. The intelligence installed in the application is typically called a tracing client or an instrumentation client. The important thing to understand is the intelligence in the application — the client — provides the means by which the application sends relevant information to the central tracing collector. This central collector is a server that is locatable on the network. (See figure 3.)

Figure 3: Tracing clients send trace and span information to a tracing server that collects the data.
Once client instrumentation is in place in an application, when the application receives a request, the tracing client gives the request a unique identifier. The identifier is usually injected into the request headers. (Putting a unique identifier in the header is a technique first developed in the correlation identifier pattern.) This identifies the transaction, which encapsulates the entire route a request takes as it travels from service to service endpoints to fulfill its mission.
In distributed tracing parlance, such a transaction is typically called a trace. Each trace is made up of spans: the activities performed during the trace, such as a call to a microservice or a database. Each span has a unique ID too. Spans can create subsequent spans called child spans, and a child span can have multiple parents.
All trace behavior is collected and stored in a common data repository such as Cassandra, Redis, etcd or Elasticsearch. Once the data is stored, it’s just a matter of slice-and-dice reporting. Typically, reporting and trace information visualization is a component in the given distributed tracing technology. However, given that distributed tracing is becoming an essential part of modern enterprise architectural frameworks, a number of open standards projects like OpenTracing and OpenCensus have emerged that let companies use a variety of reporting tools against a variety of collectors.
In order to make distributed tracing useful in terms of different testing activities, test practitioners will need to make trace reporting integration part of their planning activities. This is particularly true for designing test reports. That data will be there — it’s just a matter of analyzing it properly and then reporting the results in a meaningful manner.
Implementing Distributed Tracing
The first thing an IT department needs to do to implement distributed tracing is to decide to make a concerted effort to do it. Not make the effort, mind you, but decide to make the effort. As with any initiative that has enterprise-wide ramifications — and believe me, distributed tracing does indeed have enterprise-wide ramifications — a well-thought-out plan about how to get from point A to point B must be defined. Otherwise, your company runs the risk of reenacting the herding cats scenario, only instead of chasing a set of ever-elusive request metrics, you’re going to be chasing a pantheon of approaches to system-wide procedures designed to retrieve those metrics.
However, as many of us have learned, bringing an idea to fruition is always an order of magnitude harder than having the idea in the first place.
The entire IT department needs to have a common understanding of the need at hand and of how the need is going to be met. Achieving the goal might be done by group consensus, or by executive edict. My preference is the group consensus approach. But, if coming up with a common understanding degrades into a time and money sink of one engineer trying to be smarter than the next engineer, edict might be the plausible alternative. Again, I’m not a big fan of edicts, but a common, well-known understanding and approach to implementing distributed tracing must be established. Remember, every application, container, and machine that makes its way into a deployment cycle will be subject to the distributed tracing mechanisms you decided on.
Once the whys and hows are well understood, the next step is to realize the plan.
Realizing the Plan
A good deal of the planning activity around distributed tracing will be focused on tool selection. The good news is that there are a lot of options, many of which conform to emerging standards for publishing trace information in a common format. Thus, choosing a tool is not an irrevocable decision, but nonetheless, tools need to be chosen carefully.
There are a growing number of open source tools available for distributed tracing. There’s Zipkin, which was developed by Twitter. It’s written in Java but can be installed as Docker containers. Jaeger is another open source project. One of the nice things about Jaeger is that it has client libraries for a number of programming environments, including Java, Node.js and Go. AppDash, a distributed tracing technology based on Google’s Dapper distributed tracing solution and Zipkin, is also beginning to grow in popularity.
On the commercial end, Datadog’s APM product supports distributed tracing, as does Instana, a commercial application performance monitoring solution that focuses on microservices running in the cloud.
Moving from Tools to Practice
Once you’ve chosen your tools, you need to implement your rollout plan and then stick with it. It’s going to take a while for your IT department to use tracing tools effectively.
The developers will need to refactor code, which is an opportunity in itself. As the shift-left movement advocates, the best place for a focus on performance testing is when the code is being written.
Although the refactoring efforts that developers will do in regard to distributed tracing will most likely be around installing the instrumentation clients required, opening the code does provide an opportunity for testers and developers to work closely together. Refactoring the code can go beyond just adding the trace client. Developers and testers can work together to create new, clever ways to publish log outputs that add more insight into application performance. And all parties can use their collective wisdom to makes sure the distributed tracing efforts are being maximized.
Distributed tracing has the potential to take application monitoring and performance testing to new, unimagined levels. Seeing everything across the entire landscape of application activity, static and ephemeral, is a game-changer. The trick is to be persistent and patient. It will pay off when you have visibility into operations that used to be completely opaque.